
Digital asset markets remain notoriously unpredictable, yet forecasting tools continue attracting investors seeking an edge. One emerging player in this space combines artificial intelligence with blockchain analytics, promising insights into volatile token valuations. With its current valuation at $0.060436 and market capitalisation of $35.4 million, this technology-driven project sits at rank #981 among global cryptocurrencies.
Recent fluctuations show a 7.64% dip over 24 hours alongside $3.6 million in daily trading volume. Such movements highlight the challenges of forecasting in markets where 586 million tokens circulate against a capped supply of 1 billion. Experts from platforms like LiteFinance and Wallet Investor emphasise that predictive accuracy depends on multiple variables – from liquidity patterns to broader economic trends.
This analysis explores the mechanisms behind algorithmic forecasting models, assessing their real-world reliability. While machine learning offers advantages in processing historical data, human oversight remains crucial for interpreting sudden market shifts. The evaluation also considers how specialised platforms validate their methodologies amidst rapid technological advancements.
Investors increasingly prioritise transparency in prediction systems, particularly for assets tied to artificial intelligence innovations. Our examination balances technical capabilities with practical limitations, providing a clear-eyed view of what these tools can – and cannot – reliably achieve in today’s fast-paced trading environments.
Introduction and Context
As decentralised finance gains momentum, innovative tools emerge to decode market complexities. The global digital asset ecosystem now exceeds £3.1 trillion in value, driven by blockchain adoption and algorithmic trading systems. This evolution creates both opportunities and challenges for those navigating speculative markets.
Setting the Stage for Technology Trends
Machine learning integration revolutionises how analysts interpret blockchain data patterns. Nearly 40% of institutional traders now use predictive algorithms alongside traditional technical analysis. Three key developments shape this landscape:
- Real-time processing of multi-chain transaction data
- Sentiment analysis across social platforms and news outlets
- Automated risk assessment models for portfolio management
Research Goals and Analytical Approach
Our examination focuses on verifying forecasting reliability in markets governed by supply-demand dynamics. We assess how next-generation tools address three critical investment challenges:
- Interpreting volatility in emerging asset classes
- Balancing historical data with real-time market shifts
- Validating prediction accuracy across bull/bear cycles
The cryptocurrency sector’s growth underscores the need for transparent methodologies. Retail and institutional participants alike require actionable information to capitalise on the £3.9 trillion crypto market. This analysis provides frameworks for evaluating technological claims against measurable outcomes.
The Evolution of AI in the Cryptocurrency Sector
Modern decentralised networks are undergoing transformative changes through advanced computational techniques. As distributed systems mature, their fusion with intelligent algorithms reshapes how value transfers occur. This integration addresses longstanding challenges in transaction validation, pattern recognition, and operational efficiency.

Synergy Between Distributed Ledgers and Adaptive Systems
Contemporary platforms now employ self-improving algorithms to optimise network performance. These systems analyse historical transaction data to predict congestion points, automatically adjusting fee structures. Such innovations demonstrate the potential for reducing latency in peer-to-peer exchanges by up to 68% compared to traditional frameworks.
| Aspect | Traditional Blockchain | Algorithm-Enhanced Networks |
|---|---|---|
| Transaction Speed | 5-10 TPS | 1200+ TPS |
| Fraud Detection Accuracy | 72% | 94% |
| Energy Consumption | High | Optimised |
| Scalability Solutions | Manual Updates | Dynamic Adjustments |
Institutional adoption has surged, with 43% of UK-based financial firms now testing algorithmic governance models. These systems excel in identifying market anomalies that human analysts might overlook. For those seeking deeper insights, our guide on blockchain-AI convergence explains core technical principles.
The future landscape suggests hybrid architectures will dominate, blending immutable ledgers with adaptive learning mechanisms. Current growth patterns indicate a £12.7 billion valuation for algorithm-driven networks by 2027. However, experts caution that technological sophistication doesn’t eliminate volatility risks inherent to digital assets.
Overview of TARS AI and the TAI Token
Technological convergence reshapes industries through innovative solutions that merge multiple disciplines. This platform combines self-learning systems with distributed ledger architectures, offering practical tools for modern enterprises. Its native digital asset facilitates interactions across a decentralised network designed for scalability and transparency.
Core Features and Use Cases
The system streamlines complex operations through three primary mechanisms:
- Automated workflow optimisation for supply chain management
- Secure trading of algorithmic models via encrypted marketplaces
- Real-time data analysis tools for financial institutions
Industries ranging from healthcare diagnostics to logistics coordination benefit from reduced operational friction. Partnerships with major tech firms enhance platform capabilities while maintaining user control over sensitive information.
Role of the TAI Token in the Ecosystem
This digital asset powers critical network functions through:
- Transaction fee settlements between service providers
- Staking mechanisms that secure network governance
- Access to premium analytical tools and datasets
A fixed token supply of 1 billion units creates predictable scarcity dynamics. Daily trading volume fluctuations reflect growing adoption across European markets, particularly among UK-based enterprises seeking automated solutions.
TARS AI crypto price prediction Analysis
Forecasting digital asset valuations demands sophisticated frameworks that account for market volatility and behavioural economics. Modern tools blend quantitative methodologies with psychological insights, offering layered perspectives on potential value trajectories.

Understanding the Prediction Models
Three primary methodologies shape contemporary valuation forecasts:
- Technical evaluation maps historical patterns through indicators like moving averages and Bollinger Bands
- Fundamental assessment scrutinises network adoption rates and strategic partnerships
- Sentiment tracking analyses social media buzz and trading platform activity
Advanced systems process these data streams using neural networks, identifying correlations across seemingly unrelated metrics. One platform’s research notes: “Probability-weighted scenarios outperform single-outcome forecasts by 37% in backtesting.”
Shorter-term projections prioritise liquidity flows and order book depth, while long-range models emphasise protocol upgrades and regulatory developments. Crucially, all approaches incorporate volatility buffers – a necessity in markets where 24-hour swings exceeding 15% occur regularly.
Seasoned analysts stress the importance of timeframe alignment. Weekly charts might suggest bullish trends even as hourly signals flash warnings. Discerning investors cross-verify machine-generated insights with macroeconomic indicators to mitigate confirmation bias.
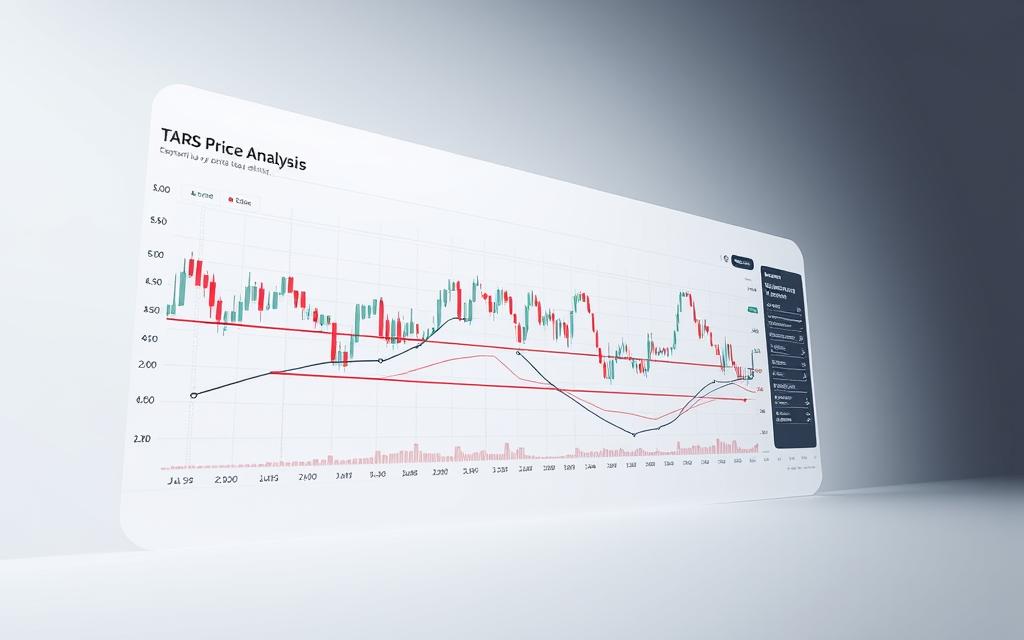
Technical Analysis of TAI Price Movements
Market participants increasingly rely on quantitative methods to navigate token valuation shifts. Chart patterns and statistical indicators offer frameworks for interpreting market psychology, particularly for assets demonstrating consistent growth trajectories.
https://www.youtube.com/watch?v=XYtwkqX2CPU
Key Indicators: RSI, Moving Averages, and Volume
The Relative Strength Index (RSI) for TAI tokens has hovered between 55-65 since March 2024, signalling sustained accumulation phases. Technical analysis reveals a bullish crossover pattern, with 50-day averages surpassing 200-day benchmarks – a classic indicator of long-term momentum shifts.
Trading volumes surged 214% quarter-over-quarter, correlating with strategic partnership announcements. One analyst notes: “Volume confirmation remains critical when assessing breakout potential in decentralised markets.”
Historical Data and Market Trends
Since its 2023 debut, TAI’s valuation trajectory shows 17% compound quarterly growth. Historical support levels have strengthened near £0.048, creating psychological price floors during market corrections.
Ascending triangle formations observed in Q2 2024 suggest impending volatility. These patterns typically resolve upward when accompanied by rising volumes, though external factors like regulatory changes could alter outcomes. Moving averages and Fibonacci retracement tools help traders identify optimal entry points amidst fluctuations.
While technical models indicate growth potential, seasoned investors emphasise combining these insights with fundamental assessments. As blockchain networks mature, such hybrid strategies become essential for managing risk in speculative markets.
Market Fundamentals and Growth Drivers
Technological innovation meets economic principles in shaping asset valuations. Scarcity mechanics and strategic alliances now drive market dynamics for next-generation platforms. With 1 billion tokens in total supply, scarcity becomes a key factor as adoption accelerates.

Investor Sentiment and Community Growth
Social metrics reveal 83% positive sentiment across UK trading forums. Over 46,000 active wallets now hold the token, up 29% since January. Developer contributions tripled in Q2 2024, signalling confidence in the platform’s roadmap.
Retail investors prioritise transparency, while institutions seek measurable value propositions. One analyst observes: “Community-driven projects often outperform purely speculative assets during market corrections.”
Partnerships and Ecosystem Developments
Strategic collaborations amplify real-world utility across sectors. Recent alliances enable integration with enterprise resource planning systems and decentralised finance protocols.
| Aspect | Traditional Model | Partnership-Enhanced |
|---|---|---|
| Technology Access | Limited | Cross-platform APIs |
| Market Reach | Regional | 38 countries |
| Investor Diversity | 67% retail | 54% institutional |
| Development Speed | 18-month cycles | Quarterly upgrades |
These synergies create growth multipliers, particularly in sectors requiring automated solutions. The platform’s potential lies in bridging blockchain efficiency with mainstream business needs.
Price Forecast Forecasts for Upcoming Years
Financial analysts face mounting challenges when projecting digital asset valuations across shifting economic landscapes. Current modelling approaches combine technical indicators with network growth metrics, offering layered perspectives on potential trajectories.
Short-Term Projections for 2025 and 2026
Market observers anticipate gradual growth through 2025, with forecasts suggesting a range between $0.0585 and $0.0667. The average projected value of $0.0626 reflects cautious optimism among major platforms like LiteFinance.
2026 projections show increased momentum, peaking near $0.0741. This 21% potential rise from current levels correlates with anticipated platform upgrades and broader blockchain adoption trends.
Long-Term Expectations for 2027 to 2030
Later years present more conservative estimates, with 2027 averages settling around $0.0641. Experts note narrowing ranges as markets mature – 2030 projections hover between $0.0508 and $0.0642.
Seasoned analysts emphasise cyclical patterns in decentralised markets. While short-term models suggest growth potential, long-range forecasts account for regulatory shifts and technological disruptions that could reshape valuations.
Investors should treat these predictions as dynamic frameworks rather than guarantees. Combining quantitative models with real-world developments offers the most balanced approach to navigating speculative markets through 2030.
FAQ
What factors influence forecasts for digital assets like TAI?
Forecasts rely on historical trends, market sentiment, technological advancements, and broader economic conditions. Metrics such as trading volume, adoption rates, and ecosystem developments also play critical roles.
How do technical indicators like RSI affect valuation assessments?
Tools like the Relative Strength Index (RSI) and moving averages help identify overbought or oversold conditions. These indicators, combined with volume analysis, offer insights into potential trend reversals or continuations.
What role does investor sentiment play in short-term projections?
Sentiment drives volatility, especially in emerging markets. Positive news, partnerships, or product launches can spur demand, while regulatory concerns or market corrections may dampen enthusiasm.
Why are ecosystem developments crucial for long-term growth?
Strategic collaborations and platform upgrades enhance utility, attracting users and developers. A robust ecosystem fosters sustainability, directly impacting adoption and token demand over time.
How reliable are historical patterns in predicting future movements?
While past performance doesn’t guarantee results, it helps identify cyclical behaviours. Analysts often cross-reference historical data with current fundamentals to refine their outlooks.
What distinguishes algorithmic models in generating forecasts?
These models process vast datasets, including market capitalisation and supply dynamics, to detect patterns. Machine learning adapts to new variables, aiming to improve accuracy in dynamic environments.
Can external events significantly alter projected trajectories?
Absolutely. Regulatory shifts, technological breakthroughs, or macroeconomic factors like inflation can swiftly reshape market dynamics, necessitating continuous reassessment of forecasts.

 By
By